www.BioTopics.co.uk
Site author Richard Steane
The BioTopics website gives access to interactive resource material, developed to support the learning and teaching of Biology at a variety of levels.

Investigating diversity

Comparing diversity

When Biologists are investigating any living organisms, they need to start from a reliable reference point. Often they need to identify and specify the species of organism concerned, and then compare it with other related organisms. Alternatively they may need to give it a scientific name of its own, and defend their decision to split it off from similar known organisms.

Originally, this involved looking at specimens of the current species, comparing it with written descriptions or previous (preserved?) specimens and deciding whether any observed differences were significant. Perhaps measurements would be made to assist in the comparison.

As our knowledge of DNA and genomics, and the associated investigatory techniques, have improved it is much more possible to make comparisons between organisms within a species and between different species using DNA, RNA and proteins, and in particular by establishing the sequences of bases and amino acids involved. Mitochondrial DNA is often used in these comparisons.

Investigating genetic diversity within a species, (possibly distinguishing varieties within a species) or making comparisons between different species used to involve observing characteristics and measuring them with a view to expaining them in terms of evolutionary relationships, but it is now thought to be much more productive to investigate DNA sequences directly.

Sorting out your giraffes


Sub species peralta peralta (9K)
Sub species giraffa giraffa (224K)


Nine subspecies of giraffe Giraffa camelopardalis have been recognized on the basis of distinctive regional differences in colour and pattern of the coat, but these groups have been called into question on the basis of variations within populations and possible hybridisation where ranges overlap.

The following variations were found within the mitochondrial DNA for cytochrome b in 2 samples each from 2 different geographical locations.

Northern Group - sub species peralta
CATTCCTTGTTTCGCTTA
CATTCCTTGTCTTGCTCA
Southern Group - sub species giraffa
TATTCTCCATCCCGTCCG
TATTCTCCATCCCGTCCG
These are not actual base sequences but a selection from the 134 positions where bases vary amongst 1765 nucleotide sites. Changes from the top line are indicated by bold type. These changes are mainly transitions: T-C, C-T, G-C, and C-G.
The lower group differs from the upper one, and shows little heterogeneity.

Another 'multi-locus analysis' concludes that there are in fact four species. See links below

Reasons for making comparisons

Encouraging genetic diversity

Animal owners know that in addition to specific characteristics that they value in their chosen breed there is sometimes a likelihood that offspring may show less favourable traits as a result of limited genetic diversity resulting from selective breeding in previous generations. For example certain dog breeds may develop problems such as bone deformations due to selection for reduced and flattened faces, or simply larger stature. And farmers, horse breeders and zoo keepers value (a certain amount of) variation in their stock, and so they maintain comprehensive records of breeding lineages in order to avoid inbreeding which reduces heterozygosity.

Discouraging interbreeding

On the other hand, there is sometimes concern that the identity and special features of some populations may be compromised by interbreeding between different populations. This may occur between populations seen as different species. The concept of a species in Biology is based on the absence of interbreeding with other species, but this definition must be refined to cover or exclude organisms that are outside their normal geographical range, probably as a result of the activities of Man.

Identifying Scottish Wildcats

wildcat (121K)
Felis silvestris is the Scottish wildcat - found in northern Scotland, although the species was once common in the rest of Britain. It is fairly similar to wild animals in Europe, which have been given various species/subspecies names. Actual numbers in the wild are unknown: numbers like 100-300 have been mentioned in recent years.

Felis catus is a name reserved for the domestic cat, which is of Asian or African origin. It is thought that feral domestic cats may mate with wildcats, producing fertile hybrid offspring, and they may also spread feline diseases and parasites. There is now a conservation plan run by Scottish Wildcat Action with the aim to restore viable populations of Scottish wildcats north of the Highland fault line. There are plans to identify different species and hybrids and possibly to institute a neutering program. Captive breeding of well validated wild cats has been successful and there are plans to set up a release program.

pelage (80K) There is no need to kill and skin the animals to identify them!
Pelage scoring involves looking at the external features - the hair/fur - of a feline of unknown origin (FUO). This may be performed using motion-sensitive cameras. Coat markings look like a standard tabby domestic cat but with a distinctive tail which is thick and has rings but no stripe. The back has a stripe but it stops at the tail. White feet are apparently only found in domestic cats.

Alternatively DNA may be extracted from blood or hair samples obtained from stakes baited with Valerian - Valeriana officinalis - or catnip - Nepeta cataria (which cat owners know is very attractive to cats). Samples can be tested in the lab and compared using single nucleotide polymorphisms (SNPs) tests against 35 nuclear DNA markers and 1 mitochondrial marker to identify the extent of hybridism or purity.

Quantitative investigations of variation

When studying a particular species, or different populations within a species, it is often useful to collect data from samples. It is important that these are representative samples, so they need to be collected at random, which is fine if taken from a large group. And other factors need to be standardised; many animals show different features between the sexes, notably body size.
This is a population of swans
swannery (16K)
Here is one swan being sampled
singleswan (321K)


It is generally not possible to do comprehensive measurements on a large number of individuals, so it is hoped that taking a random sample is a realistic alternative.

Measuring variation in plants is quite popular on field courses; leaf size can vary at different positions within a wood, depending on illumination/ dehydration effects due to exposure, or soil water concentrations. In these cases it is important to select samples randomly in terms of position, but with a systematic approach such as measuring the area of the 4th leaf along a stem, counting back from the tip, (to avoid taking samples that have not been exposed to the prevailing woodland conditions for long enough).

Mean and standard deviation

This can apply to a population being measured for taxonomic purposes, or observations concerning various individuals such as the results of an experiment where individuals are exposed to different treatments, e.g. drugs.

Once a number of measurements have been taken, it is obvious that the information needs to be converted into a form that simplifies data handling. Usually this involves taking a mean - often called the average. If all the readings are close together, you can assume that this value is reliable, although in Biology we expect to find more variation than an engineer would expect from a pack of nuts and bolts. Additionally there are a number of statistics that can be assigned to the data:

If the data collected appear to be normally distributed, the standard deviation of the mean - σ - can be used to express the spread of data about the mean.

68_95_99.7 (21K)
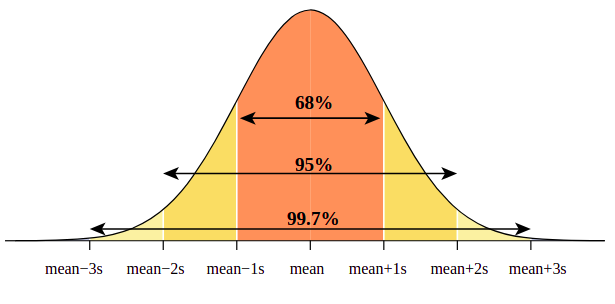
Confidence intervals: The 68- 95 -99.7 rule
68% of data are within 1 standard deviation either side of the mean
95% of data are within 2 standard deviations either side of the mean
99.7% of data are within 3 standard deviations either side of the mean

The standard deviation of a sample is calculated by summing the squares of the deviation of each data value from the mean - the difference between each value and the mean - then dividing this by the number of values -1, then taking the square root.

σ = √ Σ ( x - m )2
         n-1

where
x = (a series of) values
m = mean of those values
n = number of values in the sample

Population standard deviation: If all the members of a population are measured, the calculation above is divided by n, not n-1. If using a scientific calculator, note that these often have different keys for σ and σn-1.

Each value contributes to this statistic. It effectively reduces the effect of individual anomalies/outliers.
If a number of readings have been taken and used to give points on a graph or column chart, it is normal to use bars (sometimes called error bars) above and below the mean.

Differences between means can be said to be significant if SDs do not overlap. In fact, the more standard deviations overlap, the less likely it is that differences are real or significant. In other words they are more likely to be caused by chance.

Sometimes error bars are given as ± 2 standard deviations. These cover 95% of the constituent data points, but this is not a probability measure in itself.

Other sampling statistics

The standard error of the mean (SEM) is the standard deviation of the mean as calculated above, then divided by the square root of the number in the sample. This measures how far the sample mean of the data is likely to be from the true mean of the population.
SEM = σ / √ n

The range, equal to the top value - bottom value, is less useful as it may overly emphasise (one or two) outlying values, and nothing in between.

Investigation of genetic diversity in different breeds of dog

One hundred autosomal microsatellite markers distributed across the canine genome were used to examine variation within 28 breeds of dogs (in the USA). Part of these data relates to different types of terriers (originally bred to hunt foxes, by digging up their earths or pursuing them down the tunnels leading into the earths), and retrievers (bred to track down and bring back game that has been shot in the field).
Dog breed Mean
genetic
diversity
S.D.
Airedale terrier 0.515 0.020
Jack Russell terrier 0.758 0.012
Yorkshire terrier 0.684 0.018
Labrador retriever 0.641 0.016
Golden retriever 0.657 0.016

What do these data show about the differences in genetic diversity between these breeds of dog?

> Terriers are all different
> Genetic diversities of Jack Russell > Yorkshire > Airedale
> Retrievers' diversities are closer/closest
> S.D.s do not overlap
> But retrievers' S.D.s are close - and show a (minimal!) overlap)

Using a spreadsheet to calculate standard deviation

Spreadsheet data and display as a simple graphic
sheet (17K)


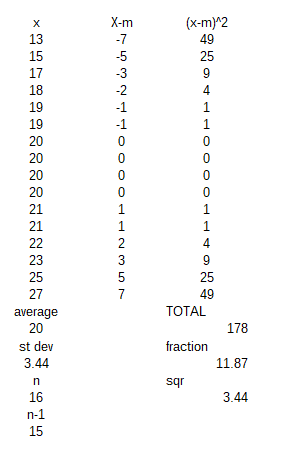
I invented some data to the right to use as an example.

I came upon some data about the mass of a species of mouse and thought I could generate the mean and standard deviation from a list of completely arbitrary numbers.

I have simply assumed that my own mouse data will cover a range of masses from 13g to 27g, with a mean value of 20g. You will see I have only used integers: whole numbers, and put them in as an ordered list - not as would happen in real life!

The first column shows that highlighting the data then selecting statistical function : STDEV displays the 'standard deviation based on a sample'.

I also set up the calculation step by step on the next 2 columns.

Luckily this gives the same results!


'Standard' scientific calculators can also be used to perform this calculation. You will probably need to refer to the instruction manual!
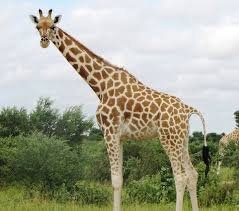
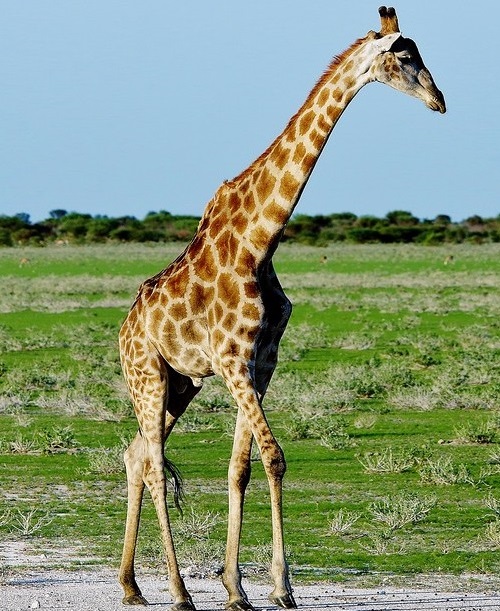
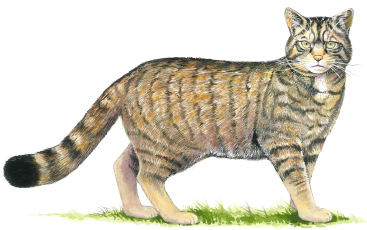
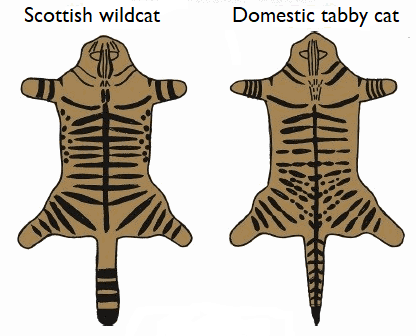
Other related topics on this site

(also accessible from the drop-down menu above)

This series (genetic information)
DNA, genes and chromosomes
DNA and protein synthesis
Genetic diversity
Genetic diversity and adaptation
Species and taxonomy
Biodiversity within a community

Evolution and speciation
Allopatric speciation

Web references


Mitochondrial DNA variability in Giraffa camelopardalis: consequences for taxonomy, phylogeography and conservation of giraffes in West and central Africa

Multi-locus Analyses Reveal Four Giraffe Species Instead of One

Darwin's Finches Get Their Genomes Sequenced The genomes of all 15 of these finch species have been sequenced, pinpointing a gene responsible for the famous beak variations
By Geoff Marsh, Nature magazine - writing in Scientific American


Phylogeny of Darwin’s finches as revealed by mtDNA sequences

How to identify a Scottish wildcat Scottish wildcats (Felis silvestris) These look similar to a large tabby cat, weighing up to 8kg and measuring as long as 98cm.

Analysis of Genetic Variation in 28 Dog Breed Populations With 100 Microsatellite Markers

Species – Wood Mouse Wood Mouse – Apodemus sylvaticus from the Mammal Society

Survey of wood mice (Apodemus sylvaticus) on the Isle of Rum pdf - lots of S.D.s

www.BioTopics.co.uk    Home     Contents     Contact via form     Contact via email     Howlers     Books     WWWlinks     Terms of use     Privacy