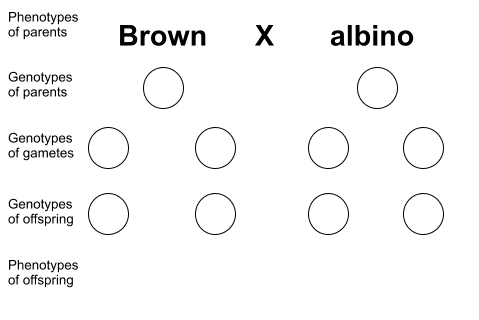
Explanation of the genetic cross diagram
Click the mouse, or tap the screen on the diagram below to start an animation showing the stages in the process
Leave the pointer over the diagram.
 The starting point with genetic diagrams is usually a description of the parents - their phenotype.
We work though a series of stages until we can state what will be the genotype and phenotype of their possible offspring.
Parental genotypes are pairs of letters, representing pairs of alleles, because they are diploid organisms (two sets of chromosomes, and alleles, in each body cell).
[BB, Bb, bb in these cases]
This may not be known for certain [BB looks the same as Bb], so sometimes we have to try out several crossing diagrams to see which one explains the facts.
When sperms and eggs are formed (by meiosis) only one allele goes into each, so divide up the pairs of letters from the parents and on the next line put one letter [B or b] for each each gamete (genotype). This is because sperms and eggs - gametes - are haploid (only one set of chromosomes, and alleles, in each gamete cell). Some people put gametes in a circle and don't use them for the other lines.
When sperm and egg join at fertilisation, it is at random. So either one of the two sperm [could be on the left] can meet either one of the two eggs [could be on the right] in the diagram. Yes I know there are likely to be different numbers: more sperms and variable numbers of eggs (only one egg with humans most of the time!) but the principle is the same. And lots of sperms don't get to do any fertilising!
This results in the offspring inheriting one allele from each parent. This new generation's genotype is shown as pairs of letters again in the next row. You just have to be systematic in pairing up one gamete, say on the left side with the two on the right side, then the same for the other on the left with both on the right side. And no, the sperm does not fertilise two eggs. The diagram just shows all the possible combinations. Some people miss out the 8 arrows seen here. And this particular cross need not use all 4 of the spaces along the bottom, but it is just the same format as the one that shows the 3:1 ratio.
Beneath that you match up the likely phenotypes of the offspring with each genotype, and add them up to see what ratio to expect.
Sometimes people put a X in the middle of the top line to signify a cross, then a large arrow down the middle below that and you just choose the combinations in order from each side.
If you came here via an external link, you may click on these icons as links to jump to the top of this page, or to go either to the contents page - a full listing of educational topics on this website - or to the front index page.

 The starting point with genetic diagrams is usually a description of the parents - their phenotype.